GainzAlgo Indicator for Beginners: How to Read Buy & Sell Signals
New traders often open a chart and freeze. Prices move fast. Candles open, stretch, and close. Meanwhile, the pressure to click "buy" grows with every tick. Because of that pressure, many beginners look for a tool that turns messy price action into something readable.
The GainzAlgo indicator exists for exactly that reason. It studies price behaviour and prints simple labels on your chart. As a result, you spend less time guessing and more time thinking.
However, a label alone will never make you profitable. You still need context, patience, and a plan. This guide covers all three.
First, you will learn what the tool actually does. Next, you will learn how to read each signal properly. Finally, you will learn how to confirm a signal before you risk real money.
What Is the GainzAlgo Indicator?
So, what is the GainzAlgo indicator in plain language? It is a chart overlay that watches price and momentum together. When certain conditions line up, it prints a visual cue directly on the candles.
Think of it as a translator. Raw price action speaks in wicks, gaps, and volume spikes. The GainzAlgo indicator turns that language into two clear words: buy and sell.
Most beginners try to read five oscillators at once. Consequently, they end up with five different opinions and zero decisions. A GainzAlgo trading indicator condenses that workload into one readable layer. Therefore, your chart stays clean and your mind stays calm.
Still, one point deserves emphasis. The tool does not predict the future. Instead, it reports that conditions have shifted right now. That difference matters more than any setting you will ever adjust.
A Quick GainzAlgo Indicator Overview
Before you trade a single signal, you need a basic GainzAlgo indicator overview. Three elements do most of the heavy lifting.
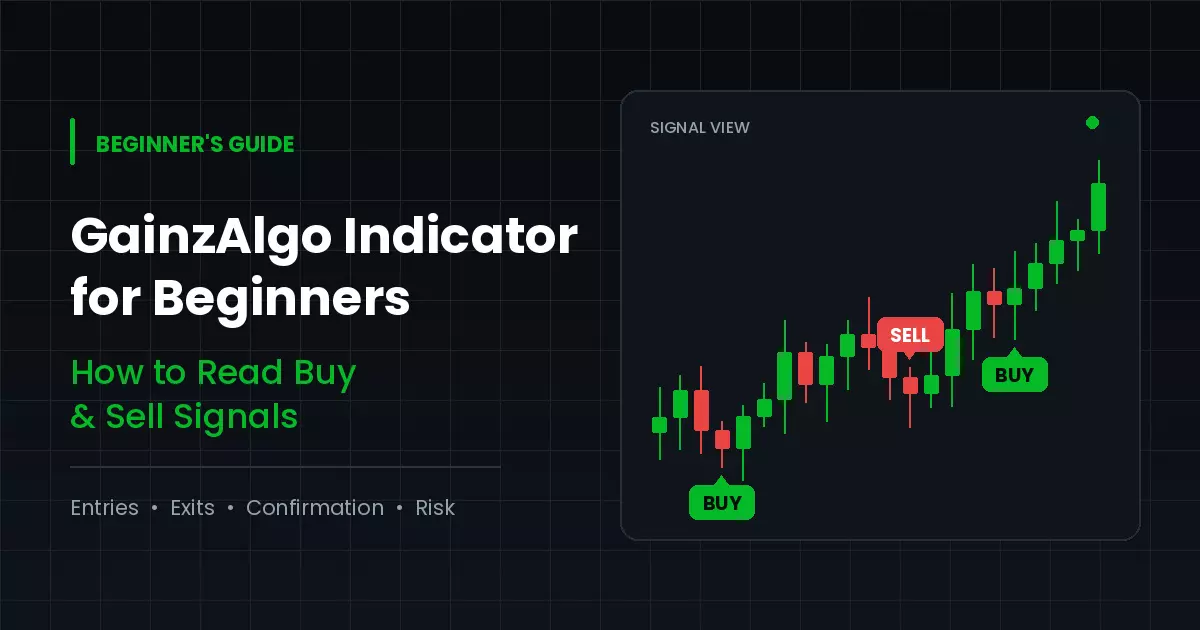
The first element is the signal label. It appears under a candle for a long entry or above a candle for a short entry. Colour separates the two, so recognition takes half a second.
The second element is the candle that carries the signal. That candle tells you how strong the move was. A long body suggests conviction. A tiny body with huge wicks suggests hesitation.
The third element is the surrounding structure. Support, resistance, and trend direction all live outside the indicator itself. Nevertheless, they decide whether a signal has room to run.
In short, the label starts the conversation. The chart finishes it.
How to Read a Buy Signal
A buy signal from the GainzAlgo indicator appears when momentum turns upward after a period of weakness. Sellers push price down. Then buyers step in and absorb the supply. Finally, price closes strongly enough to flip the reading.
When that label prints, resist the urge to click immediately. Instead, run through four quick questions.
Where did the signal appear? A buy signal near a well-tested support level carries more weight. On the other hand, a buy signal in the middle of nowhere gives you no clear place to hide a stop loss.
What is the higher timeframe doing? Zoom out one or two steps. If the daily chart trends upward, a buy signal on the one-hour chart aligns with the bigger flow. Because of that alignment, your odds improve.
How big is the signal candle? Large candles often mean the easy part of the move already happened. Sometimes, waiting for a small pullback gives you a better entry and a tighter stop.
Where will you exit if you are wrong? Answer this before you enter, not after. Otherwise, emotion will answer for you.
Only when these four answers satisfy you should you act. Patience costs nothing, yet it protects everything.
How to Read a Sell Signal
A sell signal works in reverse. Buying pressure fades. Sellers regain control. Consequently, the GainzAlgo indicator prints a label above the candle to flag the shift.
Beginners often misread this moment. They assume every sell signal means a crash is coming. In reality, it usually means one thing: the current upward push has lost steam.
That distinction changes how you respond. For example, a short-term trader might close a long position. A swing trader might simply tighten a stop and hold. Meanwhile, a bearish trader might look for a short entry, but only if the broader trend agrees.
Context also matters here. A sell signal beneath strong resistance tells a cleaner story than a sell signal inside a tight range. Similarly, a sell signal during a strong uptrend often marks a pause rather than a reversal.
Above all, remember that markets do not fall just because a label appeared. They fall because supply overwhelms demand. The signal only reports that possibility.
Read: Stock Market Training Academy in Hyderabad: A Complete
Confirmation: The Habit That Separates Traders
Experienced traders rarely act on a single input from the GainzAlgo indicator or any other tool. They stack evidence instead. You should build the same habit early, because it will save you thousands of dollars over your career.
Check the trend first
Trend is the current your trade swims in. Therefore, mark the direction of the higher timeframe before you touch any signal. Signals that swim with the current travel further and reverse less often.
Watch the volume
Volume shows participation. When a buy signal arrives with rising volume, real money supports the move. However, when volume dries up, the move may be thin and fragile.
Respect key levels
Support and resistance act as speed bumps. A signal that fires directly into heavy resistance has little room to work. In contrast, a signal that fires with open space above it has much more potential.
These three filters take about thirty seconds to apply. Nevertheless, they will remove a large share of your worst trades.
Common Beginner Mistakes to Avoid
Certain errors repeat across every new trader I have ever coached. Fortunately, each one is easy to fix.
Trading every single signal. The GainzAlgo indicator will print more labels than you can trade well, because markets produce far more noise than opportunity. Selective traders survive. Busy traders burn out.
Using a tiny timeframe too soon. One-minute charts create constant labels and constant stress. Begin on the one-hour or four-hour chart instead. Then move faster only after your reading improves.
Ignoring the spread and fees. Small gains vanish quickly when costs eat them. Therefore, calculate your real break-even point before you trade.
Moving your stop loss. A stop exists to define your risk. Once you drag it wider, that definition disappears and losses grow.
Skipping the journal. Write down why you took each signal and what happened next. After fifty entries, patterns appear. As a result, your future decisions improve dramatically.
Risk Management Beats Signal Hunting
Many beginners chase the perfect entry. Professionals focus on the exit instead, because survival funds everything else.
Start with position sizing. Risk only one to two percent of your account on any single idea. Because of that limit, a losing streak becomes an inconvenience rather than a disaster.
Next, define your reward. Aim for setups where the potential gain clearly exceeds the risk. Over time, that ratio matters more than your win rate.
Finally, accept losses as a cost of doing business. Even excellent signals fail regularly. What matters is the size of each failure, not the fact that it occurred.
Traders who learn this lesson early tend to last. Traders who ignore it rarely finish their first year.
Which Timeframe Suits Beginners Best?
Timeframe choice shapes your entire experience. Beginners often pick the fastest chart available, then wonder why trading feels exhausting.
Lower timeframes produce more signals, yet they also produce more noise. Every small wick can flip momentum. Consequently, you face constant decisions and shrinking profit targets.
Higher timeframes behave differently. A four-hour chart filters out most random movement. Signals appear less often, but each one carries more meaning. In addition, you gain hours to think rather than seconds.
For that reason, most new traders learn faster on the one-hour or four-hour chart. You still see plenty of setups. However, you avoid the emotional whiplash that fast charts create.
Market choice matters too. Liquid markets such as major currency pairs, large-cap stocks, and leading cryptocurrencies produce cleaner behaviour.
Thin markets gap and spike without warning. Therefore, any GainzAlgo trading indicator will read more reliably on instruments with steady participation.
Start slow. Speed becomes an option later, once your reading is dependable.
Reading Signals in Different Market Conditions
Markets shift between two broad states, and the same signal means different things in each one.
During a trend, signals in the trend direction tend to work best. Prices move in steps, so pullbacks offer repeated entries. Meanwhile, counter-trend signals often stall quickly.
During a range, price bounces between two levels. Here, signals near the range edges carry more value. Signals in the middle usually lead nowhere, because price simply drifts.
Learning to name the current condition takes practice. Nevertheless, it changes everything. A GainzAlgo indicator signal inside a tight range demands caution. The same signal at the edge of a clean trend deserves attention.
Ask one question before every trade. Is this market trending or ranging? Your answer should guide your expectations.
How to Practise Reading Signals
Practice should come before capital. Fortunately, charts offer a free training ground.
Begin with the replay function on your platform, with the GainzAlgo indicator loaded on the chart. Scroll back several months, then step forward candle by candle. Each time a signal appears, pause and write your decision down. Afterwards, check what actually happened.
Next, move to a demo account for two or three weeks. Treat that money as real. Keep the same position sizes you plan to use later.
Then review your notes weekly. Look for repeated errors rather than individual losses. Often, one small habit causes most of the damage.
This process feels slow. However, it compresses months of expensive learning into a few disciplined weeks.
Reading the Chart, Not Just the Label
A GainzAlgo indicator signal marks a moment of change. Your job is to judge whether that change deserves your money.
That judgement grows from screen time. The more charts you read, the faster you recognise a weak setup. Eventually, you will glance at a label and know instantly whether the surrounding structure supports it.
Until then, keep your rules simple and written down. Trade one market. Use one timeframe. Follow one checklist. Complexity can wait until consistency arrives.
Trading rewards clarity far more than cleverness. Consequently, simple routines usually outperform complicated ones.
Final Thoughts
The GainzAlgo indicator gives beginners a structured way to read momentum without drowning in technical theory.
It highlights potential entries, flags fading pressure, and keeps the chart readable. Used carefully, it shortens the learning curve considerably, especially for traders who are new to interpreting stock market trading signals.
Even so, the tool works best as part of a process. Confirm the trend. Check the level. Size the position. Then let the trade play out without interference.
Traders who follow that sequence build smarter signals with GainzAlgo and steadier habits over time, turning raw stock market trading signals into a repeatable routine rather than a one-off guess.
Above all, remember this. GainzAlgo supports your decision making, yet the decision always remains yours. Disciplined execution turns a beginner into a consistent trader, not a label on a candle.